
I was interested in whether or not people actually watch videos that we (news people) post on Facebook. I had a feeling that videos get a lot of views because they are auto-played.
Below are 4 videos I analyzed. It is a video we post each morning, and it recaps the morning’s top news stories. I think the problem is that these videos do not provide anything different from what you get on TV.
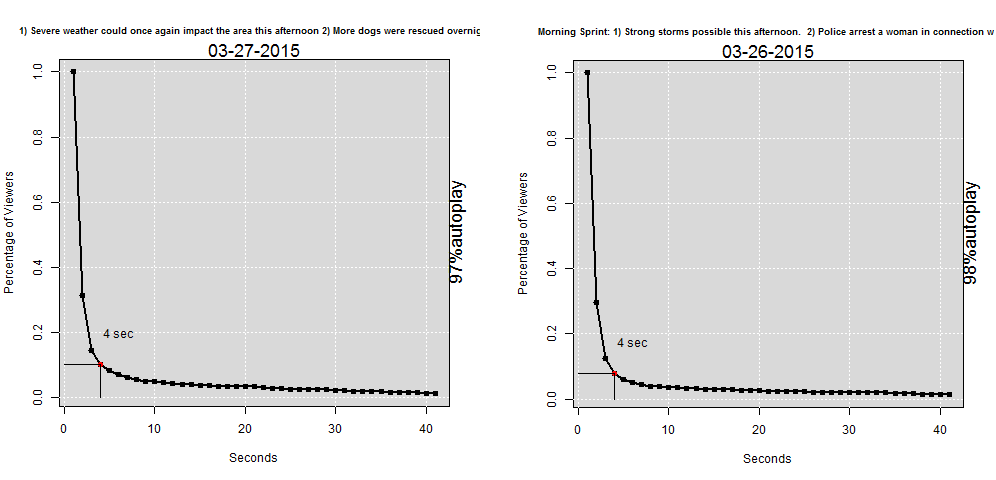

After just 4 seconds, we lost 90% of the viewing audience. I went on to find that about 99% of the “views” from our morning sprint videos were auto-played.
On the other hand, a video about a police chase had much better retention.

Obviously, a local police chase is way more entertaining than the today’s-top-stories-snooze-fest. After 13 seconds, we still had half of the viewers.
Not ALL videos are a total loss. The update video we posted about an officer shot in Ferguson did alright, yet we still lost 80% of viewers after about 7 seconds.

I went on to analyze 30ish of our last videos.
Perhaps people would rather just read a news story?
You will have to create an app on the Facebook developer site. Then you will be given a “secret” and “id”. Here is a really good tutorial to get you started: http://thinktostart.com/analyzing-facebook-with-r/
My results can be seen here:
https://weatherlisa.shinyapps.io/App-2/ (Well it looks like I have maxed out my free version of shiny apps… Trying to decide if I will upgrade to a paid version. Stay tuned.)
library(devtools)
library(scales)
library(Rfacebook)

## convert Facebook date format to R date format to be used later
format.facebook.date <- function(datestring) {
 date <- as.POSIXct(datestring, format = "%Y-%m-%dT%H:%M:%S+0000", tz = "GMT")
}

#We'll need this function later
callAPI <- function(url, token){
 if (class(token)[1]=="config"){
 url.data <- GET(url, config=token)
 }
 if (class(token)[1]=="Token2.0"){
  url.data <- GET(url, config(token=token))
 }
 if (class(token)[1]=="character"){
  url <- paste0(url, "&access_token=", token)
  url <- gsub(" ", "%20", url)
  url.data <- GET(url)
 }
 if (class(token)[1]!="character" & class(token)[1]!="config" & class(token)[1]!="Token2.0"){
  stop("Error in access token. See help for details.")
 }
 content <- fromJSON(rawToChar(url.data$content))
 if (length(content$error)>0){
  stop(content$error$message)
 }
 return(content)
}
###
###This id and secret are just dummy variables. You will get your own from
###the facebook developer app from following the tutorial I posted above
###
id <- "123456789" #Your unique id you obtained from facebook developer
secret <- "asldkfjlsdjflsdkjfl" #Your secret you obtained from facebook developer

# token generated here: https://developers.facebook.com/tools/explorer
#These expire every 2 hours
shell.exec("https://developers.facebook.com/tools/explorer") #website will auto-open in browser
token = "alsdfjasldjflasdfj" #Copy and paste the token from the above wesite

data <- getPage(id, token=token, n = 200, feed = TRUE)#Get the last 200 posts

video <- data[data$type == "video", ] #Pick out only the video posts

for(i in 1:30){
 object_id = video$id[i] #set object_id to the first video in our video dataset
 metric = "post_video_retention_graph"
 period = "lifetime"
 url <- paste0('https://graph.facebook.com/', object_id,
 '/insights/', metric, '?period=', period)
 content <- callAPI(url=url, token=token) # making query

 if(length(content$data) == 0 ){next()}

 #content$data
 #content$data[[1]]$values[[1]]
 x <- paste(content$data[[1]]$values[[1]]$value) #"unlist" the video retention data

 datetime <- format.facebook.date(getPost(object_id, token)$post$created_time)
 datetime <- format(datetime, "%Y-%m-%d")

 k <- which(abs(as.numeric(x)-.10)==min(abs(as.numeric(x)-.10))) #Find the index of x that is closest to 10%
 z <- as.numeric(x[k]) #value of x that is closest to 0.10. This will be used in the plot.

 png(paste("C:/Users/Lisa/Desktop/facebook/video plots/plot",i,".png",sep=""))
#You will have to change the path above to where you want to save the images
#on your local computer.

 plot(x, xlab = "Seconds", ylab = "Percentage of Viewers", cex.main=.75,
 main = substr(getPost(object_id, token)$post$message, 1, 100),
 type = "o", pch = 19)
 points(k, z, pch = 19, col="red")
 segments(x0 = k, y0 = 0, x1 = k, y1 = z)
 segments(x0 = 0, y0 = z, x1 = k, y1 = z)
 text(k+2, z+.10, paste(k,"sec"))
 mtext(datetime)
 grid()
 dev.off()

}

#if callApi function gives you an error, download the source code here
#https://github.com/pablobarbera/Rfacebook/blob/master/Rfacebook/R/utils.R

Nice code, but should I see code or the result?
Charles, I wasn’t quite finished yet, but someone wanted to look at my code so I went ahead and posted it. I’m making changes now.